
Ghana has experienced significant economic growth in recent years. In this article, we provide an overview through statistics, insights and trends that shed light on Ghana’s economy’s current state and future prospects.
Key takeaways
- Ghana’s poverty rate has increased from approximately 27% in 2022 to 31.4% in 2023.
- Inflation in Ghana surged from 31.5% in 2022 to 40.3% in 2023.
- Due to the Debt Exchange Programme, Ghana’s public debt reduced from 92.4% of GDP in 2022 to 84.9% in 2023.
- Ghana’s economic growth declined from 3.8% in 2022 to 2.9% in 2023.
- Ghana’s gross international reserves fell from $6.3 billion in 2022 to $5 billion by November 2023.
- The unemployment rate remained steady at 3.08% in 2023.
- The minimum wage in Ghana has increased from GHS 13.53 in 2022 to GHS 18.15 in 2024.
General macroeconomic indicators
1. The financial sector’s capital adequacy ratio declined in 2023. (AfDB)
Although the capital adequacy ratio of Ghana’s financial sector stayed above the regulatory minimum of 10%, it declined significantly from 18.22% in 2022 to 13.96% in 2023, indicating reduced financial buffers and potentially higher vulnerability to shocks.
2. There was a reduction in Ghana’s gross international reserves in 2023. (AfDB)
Ghana’s gross international reserves dropped from $6.3 billion at the end of 2022 to $5.0 billion in November 2023. This decline shows that the country now has less money saved to support the cedi and pay for imports or debts.
3. The momentum of exchange rate depreciation in Ghana declined in 2023. (AfDB)
The cedi lost value at a much slower rate in 2023, dropping by 17% compared to 60% in 2022. This improvement was mainly due to changes in the government’s economic policies.
4. Ghana’s unemployment rate was 3.06% in 2023. (Statista)
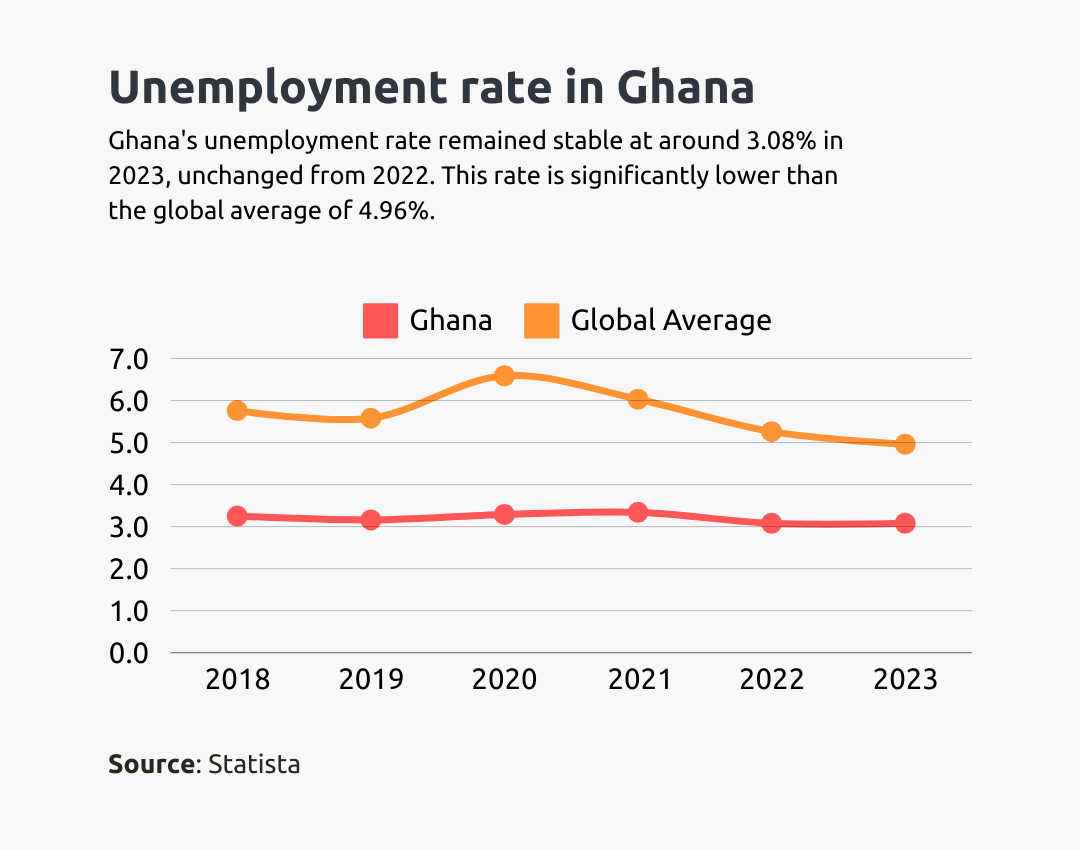
The unemployment rate in Ghana dropped slightly from 3.08% in 2022.
5. More females were unemployed than males in Ghana in 2023. (Statista)
Unemployed females in Ghana were approximately 291,800 compared to their male counterparts of about 290,100 in 2023.
6. There was an increase in the minimum wage in Ghana in 2024. (My Wage, My Wage)
The minimum wage in Ghana increased from GHS 13.53 in 2022 to GHS 14.88 in 2023 and to GHS 18.15 in 2024.
7. Poverty in Ghana increased in 2023. (World Bank)
Ghana’s national poverty rate rose from about 27% in 2022 to 31.4% in 2023, reversing previous progress. The increase is linked to high inflation, a weakening currency, and limited support for vulnerable households.
Poverty is expected to worsen, with projections showing it could reach 51.2% by 2027 (based on the LMIC poverty line), while extreme poverty may climb to 26.9%.
Ghana’s economic growth
8. Ghana’s economic growth was estimated at 2.9% in 2023. (AfDB)
The economic growth of Ghana declined from 3.8% in 2022 to 2.9% in 2023.
9. Ghana’s GDP deficit declined to 4.6% at the end of 2023. (Afdb)
According to the African Development Bank’s 2023 economic report, Ghana’s budget deficit shrank from 11.8% of the country’s GDP in 2022 to 4.5% in 2023. This was mainly because the government took steps to control spending and increase revenue.
10. There was a reduction in Ghana’s current account deficit in 2023. (AfDB)
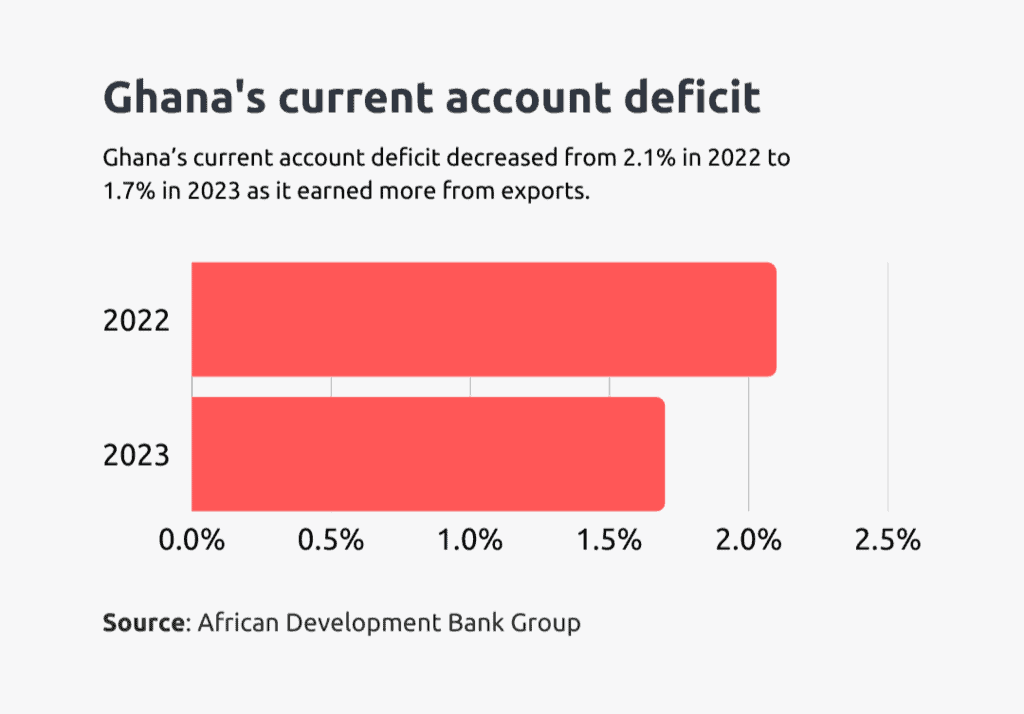
Ghana’s current account deficit decreased, dropping from 2.1% of the economy in 2022 to 1.7% in 2023 as the country earned more from its exports.
11. The service sector contributed the highest to Ghana’s GDP in 2022. (Statista, Ghana Statistical Service)
In the fourth quarter of 2023, Ghana’s services sector recorded the highest growth at 5.1%, followed by agriculture at 4.5% and industry at 1.6%.
In 2022, services contributed the most to GDP at 42.78%, while industry and agriculture contributed 31.47% and 19.51%, respectively.
12. Sectors responsible for driving GDP in quarter four of 2023. (Ghana Statistical Service)
In the last quarter of 2023, Ghana’s economic growth was mainly driven by activities in mining and quarrying, farming, information and communication, manufacturing, and trade, including vehicle and household goods repairs.
13. Ghana’s non-oil and gas GDP growth rate declined in the third and fourth quarters of 2023. (Ghana Statistical Service)
Ghana’s non-oil and gas GDP growth rate declined from 4.2% in the fourth quarter of 2022 to 3.4% in the fourth quarter of 2023 and from 3.3% in the third quarter of 2022 to 2.1% in the third quarter of 2023.
Ghana inflation statistics
14. Inflation in Ghana was higher in 2023. (AfDB, World Bank)
Inflation in Ghana rose from 31.5% in 2022 to 40.3% in 2023, mainly because of rising food prices and a weaker cedi.
By the end of the year, inflation had dropped to 23.8%, but food costs and currency depreciation still played a big role. Over the same period, the cedi lost 19.0% of its value against the US dollar.
15. Ghana’s year-on-year inflation rate stood at 25.8% as of March 2024. (Ghana Statistical Service)
Ghana’s inflation rate was estimated at 25.8% between March 2023 and March 2024, based on the Consumer Price Index (CPI). However, prices rose at a slower pace each month, dropping from 2.0% in January 2024 to 1.6% in February, and then to 0.8% in March.
16. Ghana’s year-on-year inflation rate stood at 22.8% as of June 2024. (Ghana Statistical Service)
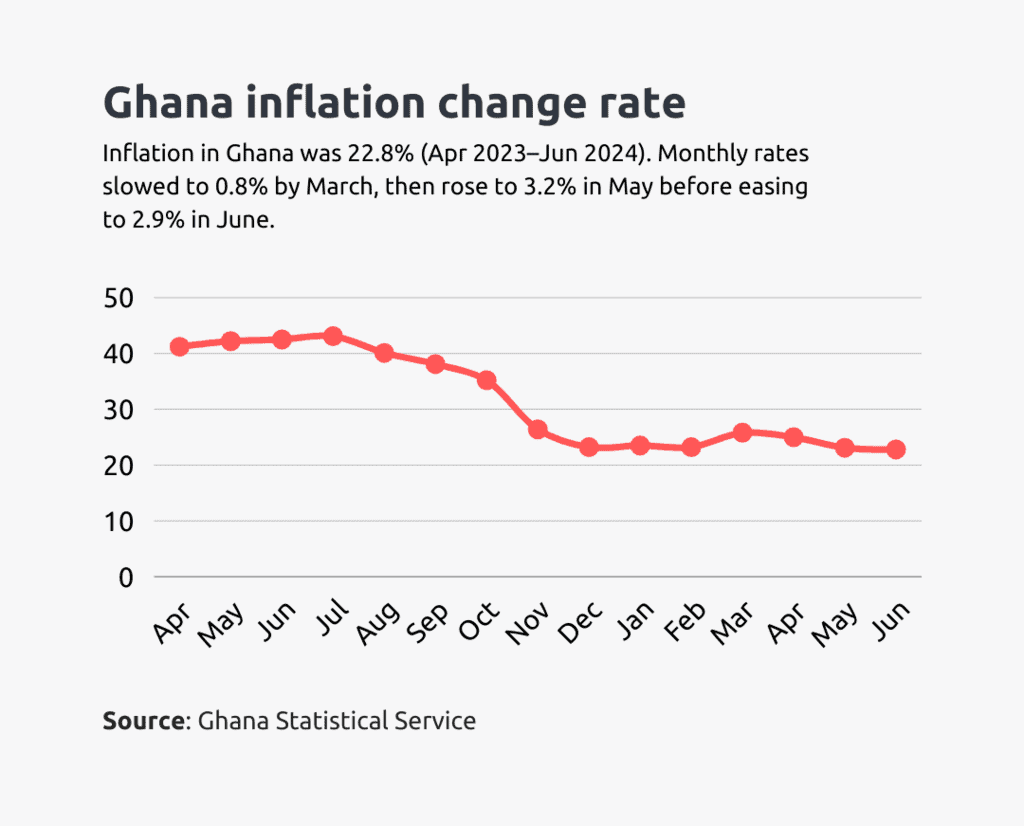
Inflation between June 2023 and June 2024 was estimated at 22.8%, based on the Consumer Price Index (CPI). On a monthly basis, inflation rose from 1.8% in April 2024 to 3.2% in May, before easing slightly to 2.9% in June.
17. From March 2023 to March 2024, food and non-alcoholic beverages experienced a higher inflation rate. (Ghana Statistical Service)
Between March 2023 and March 2024, prices for food and non-alcoholic drinks rose by 29.6%, while the prices of non-food items increased by 22.6%. This means food costs continued to be a major driver of inflation over the year.
18. The Upper East Region recorded the highest inflation rate in Ghana. (Ghana Statistical Service)
In March and June 2024, the Upper East Region recorded the highest year-on-year inflation rates in Ghana, 42.9% in March and 35.2% in June. These figures were significantly above the national averages of 25.8% and 22.8%, respectively.
The table below shows the year-on-year inflation rates per region in March and June.
| Region | March 2024 (%) | June 2024 (%) |
|---|---|---|
| Oti | 14.3 | 12.5 |
| Greater Accra | 17.4 | 22.1 |
| Western North | 17.5 | 17.3 |
| Ahafo | 20.0 | 19.8 |
| Savannah | 24.5 | 22.4 |
| Ashanti | 25.5 | 20.2 |
| Central | 25.5 | 23.0 |
| Bono East | 25.6 | 28.0 |
| NATIONAL | 25.8 | 22.8 |
| Bono | 26.3 | 22.4 |
| Upper West | 26.9 | 19.3 |
| North East | 29.9 | 17.6 |
| Northern | 31.4 | 22.4 |
| Eastern | 36.9 | 28.1 |
| Western | 37.4 | 24.6 |
| Volta | 38.5 | 22.1 |
| Upper East | 42.9 | 35.2 |
19. From March 2023 to June 2024, food and non-alcoholic beverages experienced a higher inflation rate. (Ghana Statistical Service)
The food and non-alcoholic beverages recorded an inflation rate of 24.0% from June 2023 to June 2024, while the non-food group recorded an inflation rate of 21.6% from March 2023 to March 2024.
Ghana debt statistics
20. Ghana’s public debt reduced in 2023. (AfDB)
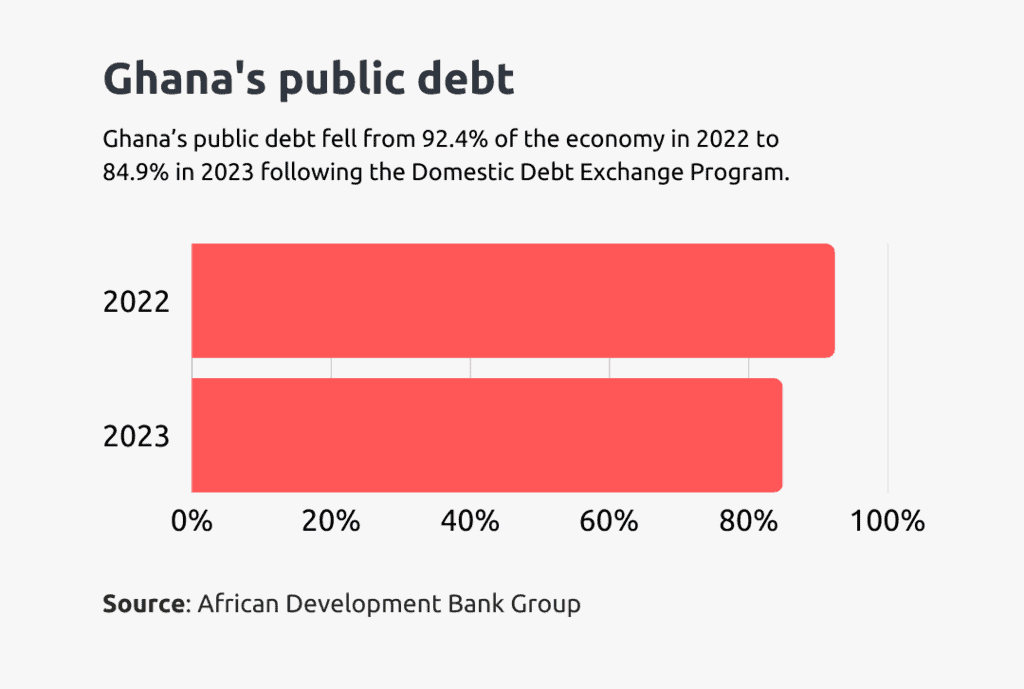
Ghana’s public debt fell from 92.4% of the economy in 2022 to 84.9% in 2023, mainly due to the impact of the Domestic Debt Exchange Program.
21. Ghana’s debt stock stood at GH₵569.35 billion in the first quarter of 2023. (MOFEP)
Ghana’s public debt stood at GH₵569.35 billion at the end of Q1 2023, equal to 71.1% of GDP, slightly down from 71.3% in Q4 2022. This included GH₵322.56 billion in external debt and GH₵246.79 billion in domestic debt.
22. Ghana’s debts worth GH₵34.80 billion were serviced in the first Q1 quarter of 2023. (MOFEP)
Ghana received GH₵50.35 billion in total funds during the first quarter of 2023. This included GH₵2.82 billion from external sources and GH₵47.53 billion raised locally.
During the same period, the government used GH₵34.80 billion to repay debts: GH₵1.10 billion for external debt and GH₵33.70 billion for domestic debt.
Entrepreneurship and business
23. The number of newly registered businesses increased in 2023. (Statista)
Registered new businesses increased from 660,430 in 2022 to 810,240 in 2023.
24. There was a decline in the number of tech startups in Ghana in 2023. (Statista)
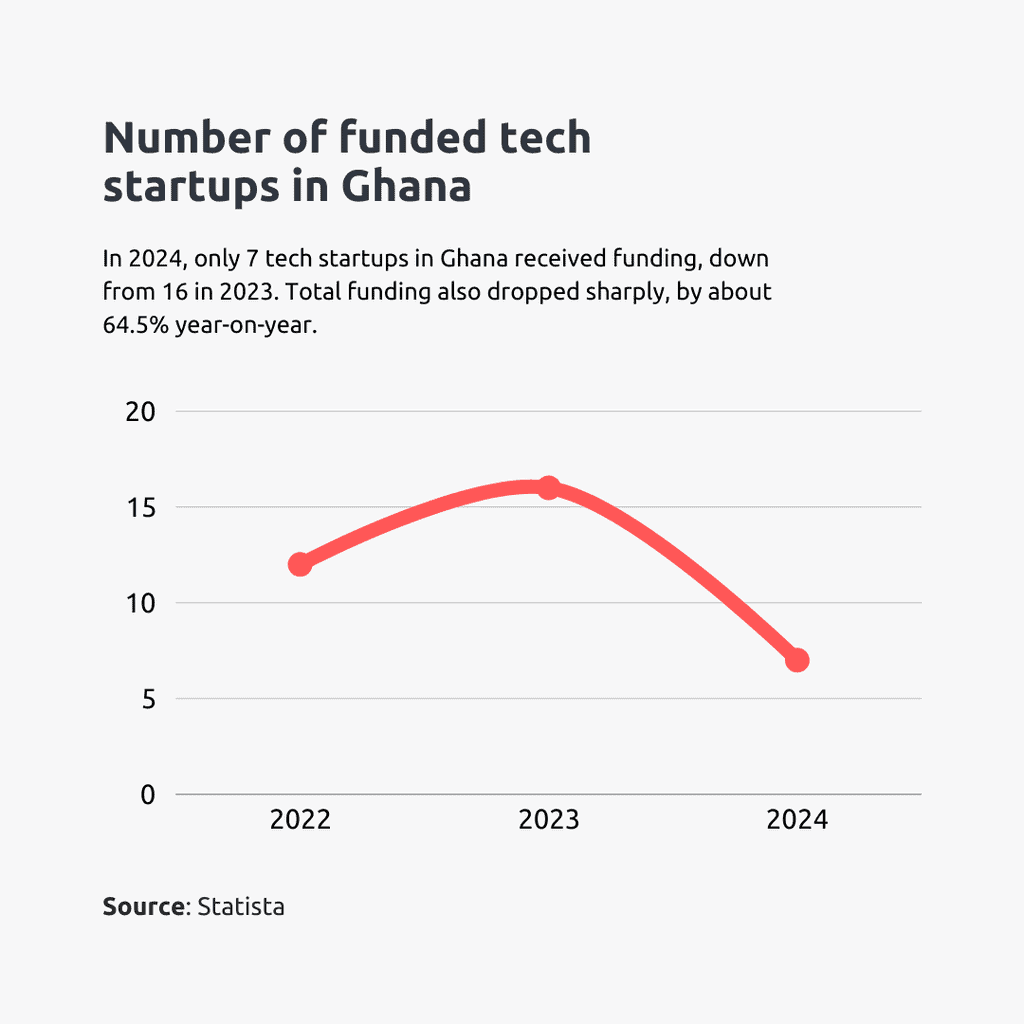
The number of tech startups in Ghana reduced from 23 businesses in 2022 to 16 in 2023.
25. More than half of businesses in Ghana were Small and Medium Enterprises in 2023. (Ghana Commercial Bank)
Small and medium-sized enterprises (SMEs) make up over 90% of all businesses in Ghana. They also provide about 80% of jobs and contribute around 60% to the country’s GDP.
26. Share of all SMEs in Ghana in 2023. (Ghana Commercial Bank)
In 2023, Ghana’s MSME sector had about 2.1 million businesses. Micro, small, and medium enterprises each played a distinct role in job creation.
| Category | No. of Businesses | Share of MSMEs | Jobs Created | Share of MSME Jobs | Avg. Jobs per Business |
| Micro Enterprises | 1.7 million | ~81% | 2.5 million | 30% | 1–2 |
| Small Enterprises | 320,000 | 15% | 1.9 million | 23% | 6 |
| Medium Enterprises | 85,000 | 4% | 3.9 million | 47% | 46 |
27. MTN Ghana (Scancom Plc) was judged the company with the largest market capitalisation in Ghana in 2023. (Statista)
With a market capitalisation of over $1.33 billion, MTN Ghana was the largest company in Ghana and was followed by Tullow Oil, with a market capitalisation of about $564 million.
28. Ghana Oil Company Limited (GOIL) had the largest market share among all oil companies in Ghana in the third quarter of 2023. (Statista)
Ghana Oil Company Limited (GOIL) was named the oil company with the largest market share in Ghana, with about 14.72% of the market share among all oil companies in the third quarter of 2023.
Agribusiness and agro-trade
29. The Northern region was the leader in paddy rice production in 2022. (Agric in Africa)
The Northern Region led in paddy rice production, contributing 28% of the national total. Together with the Volta and Upper East Regions, these three account for 72% of the country’s total output.
30. Rice production increased in 2022. (Agric in Africa)
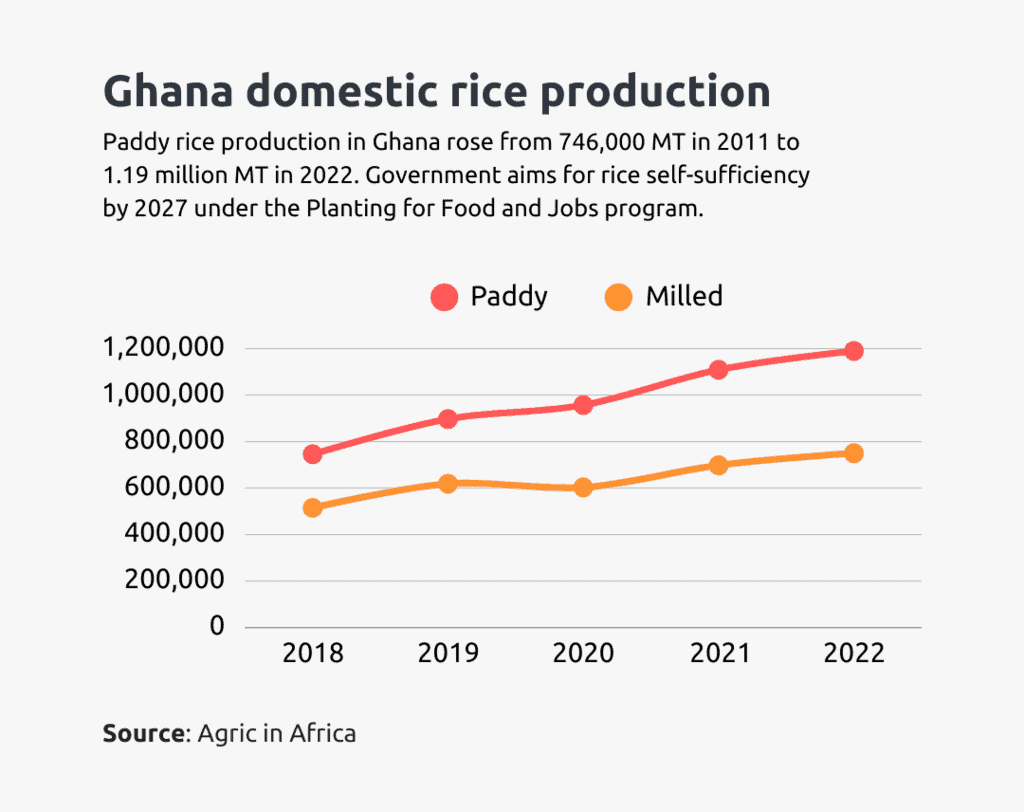
In 2022, Ghana produced 1.19 million metric tonnes of paddy rice and 750,000 metric tonnes of milled rice, up from 1.11 million and 698,000 metric tonnes, respectively, in 2021.
Despite this growth in local production, rice imports also increased, rising from 667,000 metric tonnes (US$192 million) in 2021 to 830,000 metric tonnes (US$283 million) in 2022.
31. There was more dependency on rice in Ghana in 2022. (French Embassy)
In 2022, Ghana became more dependent on rice, and about 60% of the rice consumed in 2022 was imported to supplement local production.
32. 38,792 tonnes of shea butter were exported from Ghana in 2022. (iAfrica)
38,792 tonnes of shea butter, amounting to $92.6 million, were exported from Ghana in 2022, up from 36,162 tonnes in 2021.
Ghana trade statistics
33. Ghana ranked as the 71st exporter worldwide in 2023. (Observatory of Economic Complexity)
In 2023, Ghana ranked 71st out of 226 countries in total exports.
34. In 2023, gold was the most exported commodity in Ghana. (Observatory of Economic Complexity)
In 2023, Ghana’s leading exports were gold ($15.6 billion), crude petroleum ($5.13 billion), cocoa beans ($1.09 billion), manganese ore ($501 million), and cocoa paste ($440 million).
35. Ghana’s main export destination was Switzerland in 2023. (Observatory of Economic Complexity)
In 2023, Ghana’s top export destinations were as follows:
| Country | Export value (USD) |
|---|---|
| Switzerland | $6.49 billion |
| United Arab Emirates | $4.93 billion |
| India | $2.26 billion |
| South Africa | $1.85 billion |
| China | $1.83 billion |
36. In the first half of 2023, South Africa and Egypt were Ghana’s main imports from within Africa. (Ghana Statistical Service)
Each country exported goods worth over GH₵1.2 billion to Ghana during the period.
37. Ghana exports and imports less to countries within the ECOWAS. (Ghana Statistical Service)
In 2023, 41.7% of Ghana’s exports to Africa went to ECOWAS countries, while 58.3% went to other African nations. On the import side, 28.7% of Africa-sourced imports came from ECOWAS, with the remaining 71.3% from other African countries.
38. Gold is the main export commodity to South Africa. (Ghana Statistical Service)
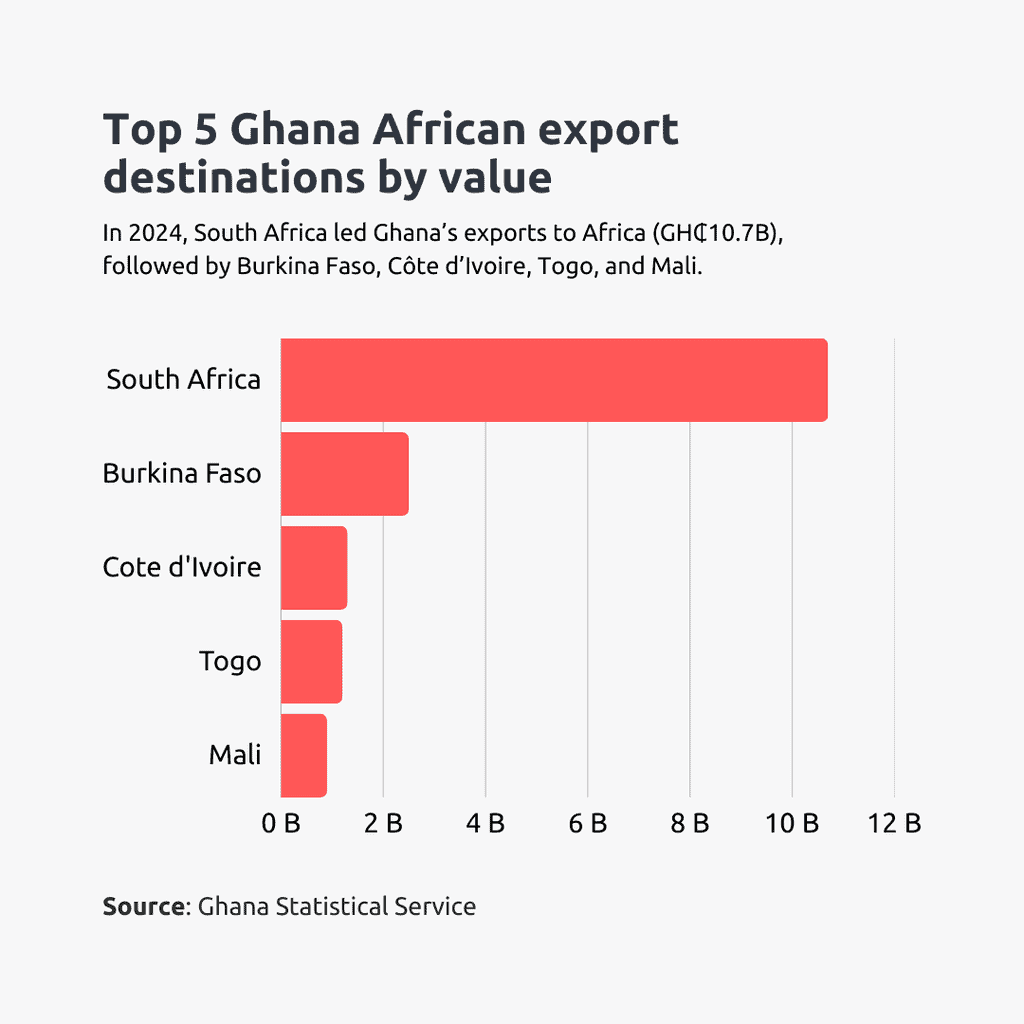
South Africa was Ghana’s top African export destination in 2023, receiving goods worth GH₵10.7 billion, over four times the value of exports to the second-largest destination, Burkina Faso (GH₵2.5 billion).
Gold accounted for 84.9% of exports to South Africa.
39. Ghana exports to about 97% of African countries. (Ghana Statistical Service)
In 2024, Ghana traded with 52 African countries, down by two for imports and one for exports compared to 2023.
The two countries most likely excluded from Ghana’s intra-African trade are Seychelles and São Tomé and Príncipe, based on longstanding trade patterns and the absence of direct trade flows in previous years.
40. Ghana’s exports to African countries amounted to GH₵19.3 billion in the first half of 2023. (Ghana Statistical Service)
In the first half of 2023, Ghana exported GH₵19.3 billion worth of goods to African countries, making up 22.0% of total exports.
In contrast, imports from African countries totalled GH₵7.7 billion, less than half the value of exports, and accounted for 9.1% of total imports.
41. Ghana’s food exports were 23.9% of the total in the first half of 2023. (Ghana Statistical Service)
As of mid-2023, food products made up 23.9% of Ghana’s total exports, valued at GH₵20.9 billion out of GH₵87.4 billion in total exports.
On the import side, food products accounted for just 13.3% of total imports, with a value of GH₵11.3 billion out of GH₵85.0 billion in total imports.
42. Mineral fuels and oils were the most imported from Europe. (Ghana Statistical Service)
Mineral fuels and oils accounted for the largest share of Ghana’s imports from Europe in the first half of 2023, making up 60.3% of the total import value from the region.
This was followed by machinery and electrical equipment (9.7%) and chemical products (7.5%). Overall, Ghana imported goods worth GH₵36.5 billion from Europe.
Here is the table showing the total value of Ghana’s imports from each region in 2023:
| Region | Import Value (GHS, billion) |
|---|---|
| Europe | 36.5 |
| Asia | 31.5 |
| Africa | 7.7 |
| North America | 6.1 |
| South America | 1.9 |
| Oceania | 1.2 |
43. Four countries worldwide accounted for 99.5% of Ghana’s gold exports in the first half of 2023. (Ghana Statistical Service)
The four countries that accounted for 99.5% of Ghana’s gold exports in the first half of 2023 are Switzerland (44.4%), South Africa (24.1%), the United Arab Emirates (18.1%), and India (12.9%).
44. The value obtained from exporting plywood from Ghana decreased in 2022. (Statista)
The value obtained from the export of plywood from Ghana declined from US$11,862,000 in 2021 to US$9,630,000 in 2022.
Ghana agricultural statistics
45. The agriculture sector contributed about GHC 177.6 billion to Ghana’s GDP. (Statista)
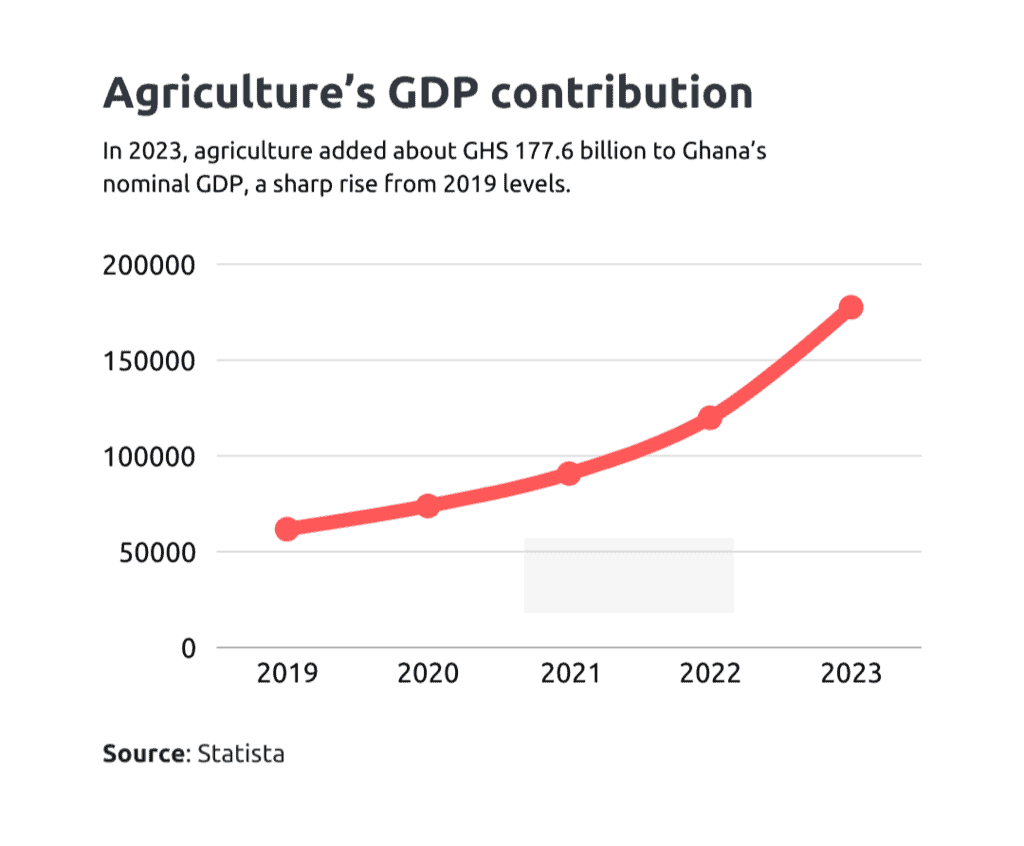
In 2023, the agriculture sector contributed about GHS 177,607 million to Ghana’s GDP, an increase from 119,879 million in 2022.
46. There was an increase in cassava production in Ghana in 2022. (Statista)
Cassava production in Ghana in 2022 was 25.6 million metric tons of cassava, a rise in quantity from 25 million metric tons in 2021.
47. 1.1% of people practising aquaculture in Ghana have a disability. (Ghana Statistical Service)
About 1.1% of Ghana’s aquaculture holders aged 15 and above have a disability. Most are in the Western, Volta, and Western North regions.
The table below shows the regional distribution of aquaculture holders with disabilities in Ghana:
| Region | % of Holders with Disability |
|---|---|
| Western | 26.7% |
| Volta | 26.7% |
| Western North | 26.7% |
| Eastern | 13.3% |
| Ashanti | 6.7% |
48. Chicken production increased in 2022. (Statista)
Approximately 89 million chickens were produced in Ghana in 2022, an increase from 81 million in 2021.
49. Four hundred sixty thousand metric tonnes of chickens were consumed in Ghana in 2022. (My Joy Online)
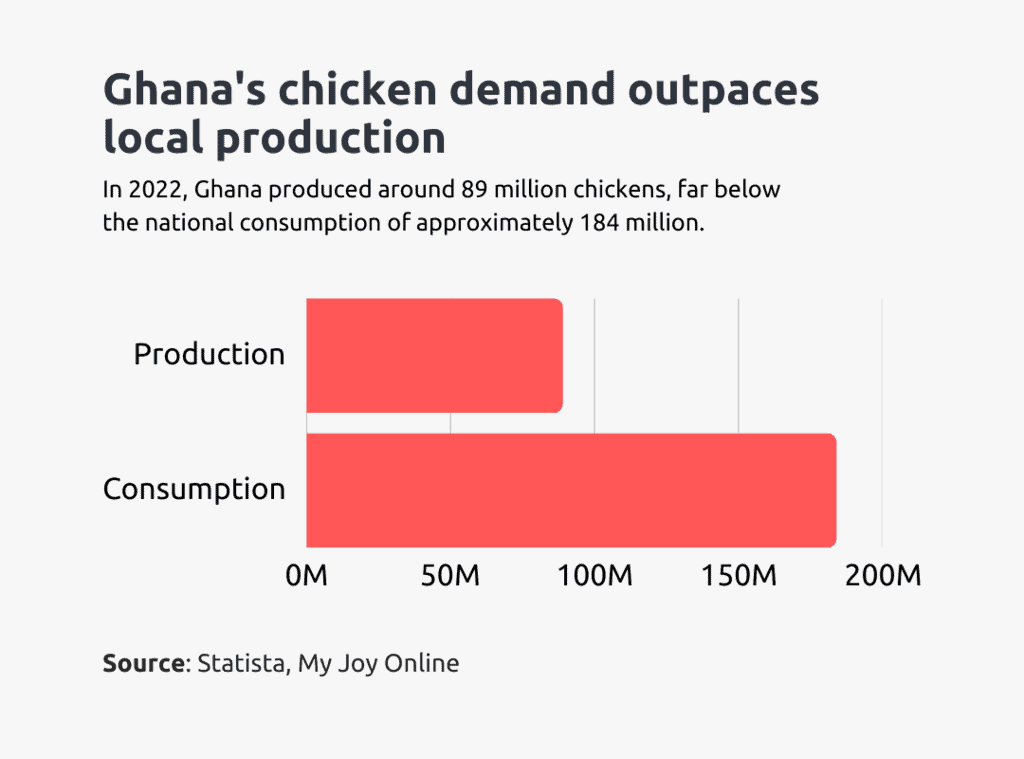
Local chicken production only met part of the demand, as the country consumed around 460,000 metric tonnes of chicken, equivalent to about 184 million birds.
50. The value of timber and timber products exported from Ghana declined in 2023. (Statista)
The value of timber and timber products exported from Ghana totalled about $143 million in 2023, compared to about $161 million in 2022.
51. The value of cocoa beans and products exported from Ghana declined in 2023. (Statista)
The value of cocoa beans and products exported from Ghana totalled about $2.1 billion in 2023, which indicates a decrease from about $2.28 billion in 2022.
FAQs
Is Ghana a poor country?
The World Bank classifies Ghana as a lower-middle-income country, yet poverty remains widespread, especially in rural areas.
What is the largest contributor to Ghana’s GDP?
The service sector is the largest contributor to Ghana’s GDP, contributing 47% as of 2023.
How much of Ghana is in poverty?
Approximately 2.99 million people in Ghana are estimated to be living in extreme poverty.
Conclusion
While various sectors have improved, issues such as high debt, inflation, and poverty remain pressing concerns.
These issues require effective policy interventions to ensure that economic growth is inclusive and sustainable.
What are your thoughts on this? We welcome your feedback on this analysis.


